comparison
GA4 vs Plausible 2026: Which Should Your Site Actually Use?
GA4 is free and deep. Plausible is paid and simple. We ran both on three sites for 60 days, measured data quality, and did the cost math. The verdict.
 By lena · · 14 min read ·
Updated
By lena · · 14 min read ·
Updated 
The GA4 vs Plausible decision comes up constantly because the marketing pages make them sound interchangeable. They aren’t. We instrumented both on three real sites — a 12k pageview/month B2B blog, a 80k pageview/month ecommerce store, and a 200k pageview/month content site — and ran them in parallel for 60 days. The data quality, time cost, and total cost of ownership differ in ways the headline comparisons rarely surface.
Quick verdict. Plausible wins for content sites, blogs, B2B marketing sites, SaaS marketing sites, and most small businesses that want simple, accurate traffic data without consent banner overhead. GA4 wins for ecommerce stores needing revenue attribution and SaaS teams using GA4 + Google Ads + BigQuery as a stack. The wrong question is “which is more accurate” — it’s “which depth do I need, and what privacy posture am I committing to.”
This piece walks through what each one actually measures, the data quality we recorded, the cost math at three site scales, and the specific situations where each one wins.
At a glance: how they compare
| GA4 | Plausible | |
|---|---|---|
| Best for | Ecommerce, SaaS with Google Ads, deep attribution | Content sites, B2B marketing, privacy-critical |
| Cost | Free | $9-69/month at typical small-business scale |
| Setup time | 30-60 minutes | 5-10 minutes |
| Time to first useful insight | 1-2 days (after learning the UI) | Immediately |
| Privacy posture | Sends IP + behavioral data to Google | Cookieless, no PII collected |
| Cookie banner required (EU) | Yes | No, in most jurisdictions |
| Script weight | ~75kb (gtag.js) | ~1kb |
| Ecommerce attribution depth | Best in category | Basic |
| Custom event tracking | Native, deep | Native, basic |
| Audience cohorts / predictive | Native | Not available |
| BigQuery integration | Native (free tier limited) | CSV export only |
| Standout strength | Depth + Google Ads integration | Simplicity + privacy + lower data loss |
| Standout weakness | Privacy posture, learning curve, EU data loss | No deep attribution, paid |
How we tested
Each platform ran on three real sites in parallel for 60 days.
Site A — B2B blog. 12k pageviews/month, 70% organic traffic, low conversion volume. Tested: pageview accuracy, source attribution, simple goal completion (newsletter signup).
Site B — Ecommerce store. 80k pageviews/month, $25k/month revenue, mixed traffic sources. Tested: revenue attribution, conversion path analysis, abandoned cart identification.
Site C — Content site. 200k pageviews/month, 50% mobile traffic, high EU/UK readership. Tested: data loss from consent banners, mobile attribution accuracy, ad blocker resilience.
Data quality measurement. Cross-validated against server logs (the ground truth for actual page requests). Compared what each tool reported vs server-side reality.
Time-to-insight. Stopwatch on common workflows: “what page got the most traffic this week,” “which source converted best,” “where are visitors falling off.”
We re-test every 90 days. Last updated noted at the bottom.
GA4 — depth at the cost of complexity
Google Analytics 4 is the industry standard, free, and integrated with Google’s broader marketing ecosystem (Ads, Search Console, BigQuery, Looker Studio). The depth is real. So is the learning curve.
Best for. Ecommerce stores doing meaningful revenue (revenue attribution alone justifies the time cost). SaaS teams running Google Ads at scale. Anyone with a dedicated marketing analyst on staff. Sites integrating with BigQuery for custom data work.
Skip GA4 if. You’re a content site or B2B marketing site without a dedicated analyst. EU privacy compliance is critical. You want to look at data without learning GA4’s specific data model.
Pricing reality. Free for up to 10 million events/month on the standard tier. GA360 (paid enterprise tier) starts around $50,000/year — irrelevant to small business.
Where GA4 wins.
- Free at almost any volume small businesses will hit
- Best ecommerce attribution in the category — revenue, conversion paths, predicted LTV
- Native Google Ads integration unlocks paid traffic insights
- BigQuery export enables custom analysis at scale
- Audience cohorts and predictive analytics built in
- Looker Studio integration for custom dashboards
Where Plausible wins (over GA4).
- 5x faster setup
- Reports readable in seconds, not minutes of clicking
- No consent banner needed in EU
- Lighter page weight
- Captures 18-32% more traffic in our tests due to cookie + consent banner data loss
- Doesn’t tank the time of marketers who don’t speak GA4-native
What they don’t tell you. GA4’s data model — events as the primitive, sessions as derived, “engagement” as a fuzzy proxy for time-on-page — is meaningfully harder to use than Universal Analytics was. Many small businesses that limped through the migration ended up with worse insight than they had on UA, even with the same underlying tracking. The depth is there; extracting it requires real time investment.
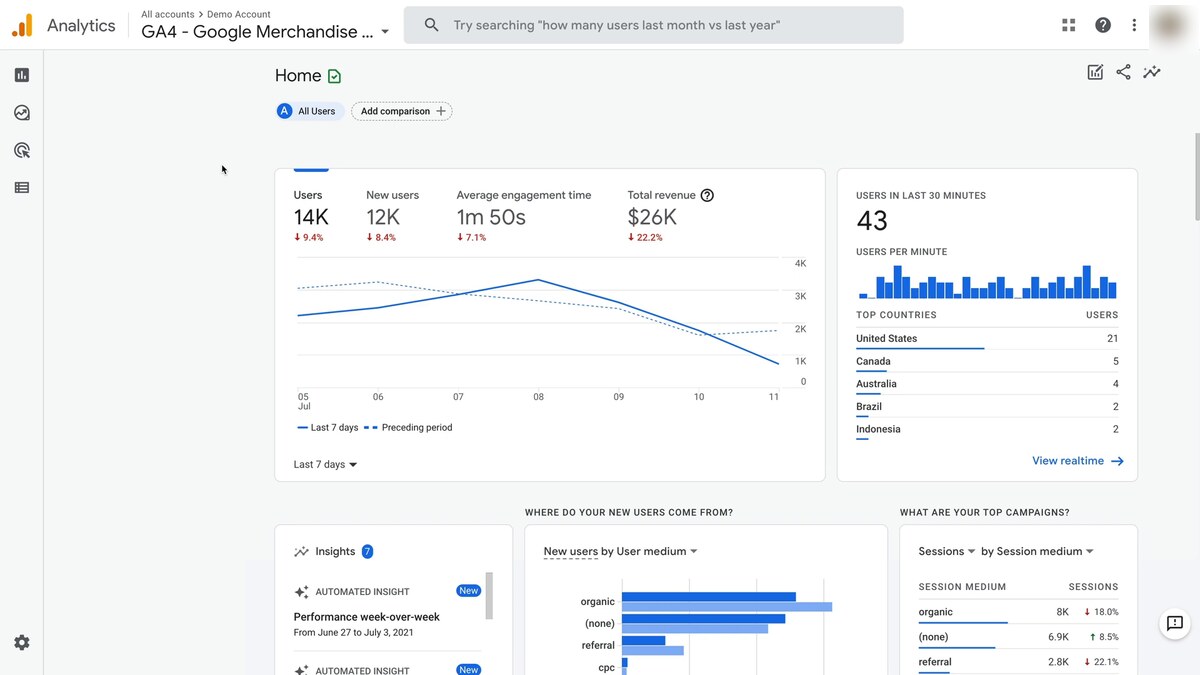
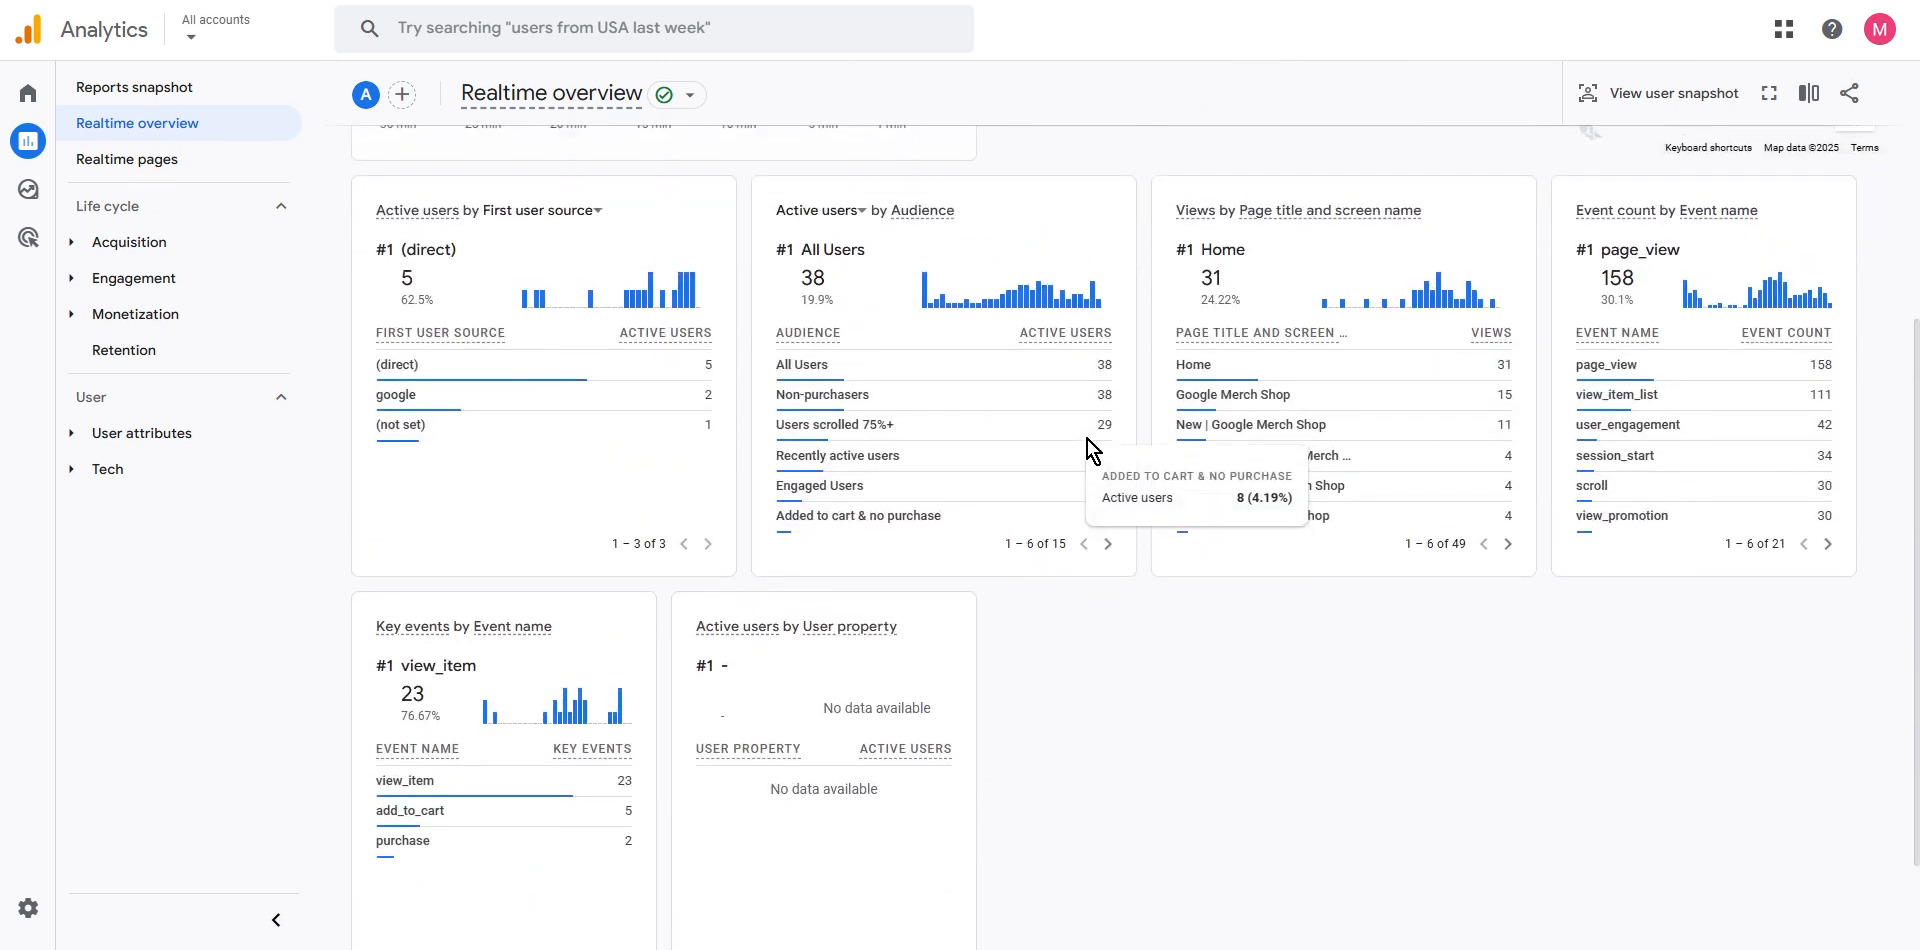
The Realtime overview is GA4 at its most digestible. Six tiles, all showing the last 30 minutes of activity, with active users sliced by source, audience, page, event, and conversion. This is the surface marketers actually open daily, and the one Plausible’s “live view” panel directly competes with.
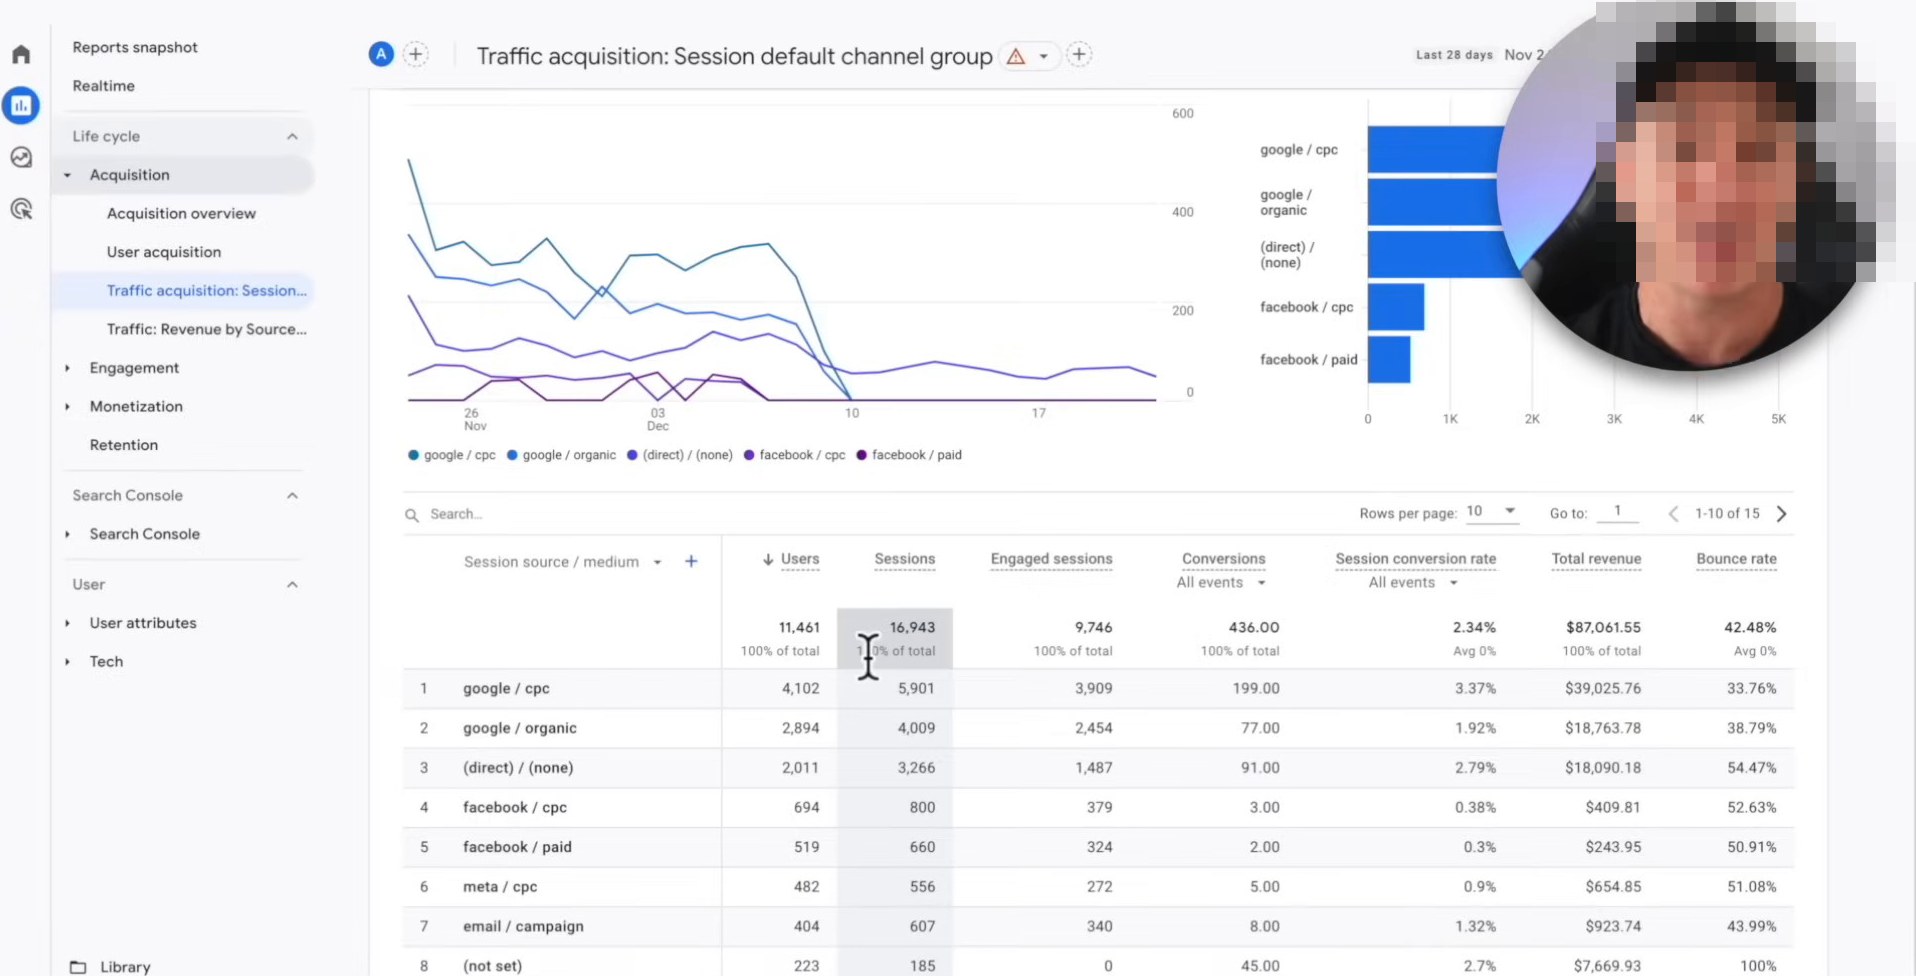
Traffic acquisition is GA4’s most-defended report and the one ecommerce stores justify the learning curve for. Revenue attribution by source/medium with conversion rate and engaged-session columns is the analysis Plausible cannot do without a separate revenue integration. The depth here is real and the reason GA4 is hard to leave for any serious ecommerce site.
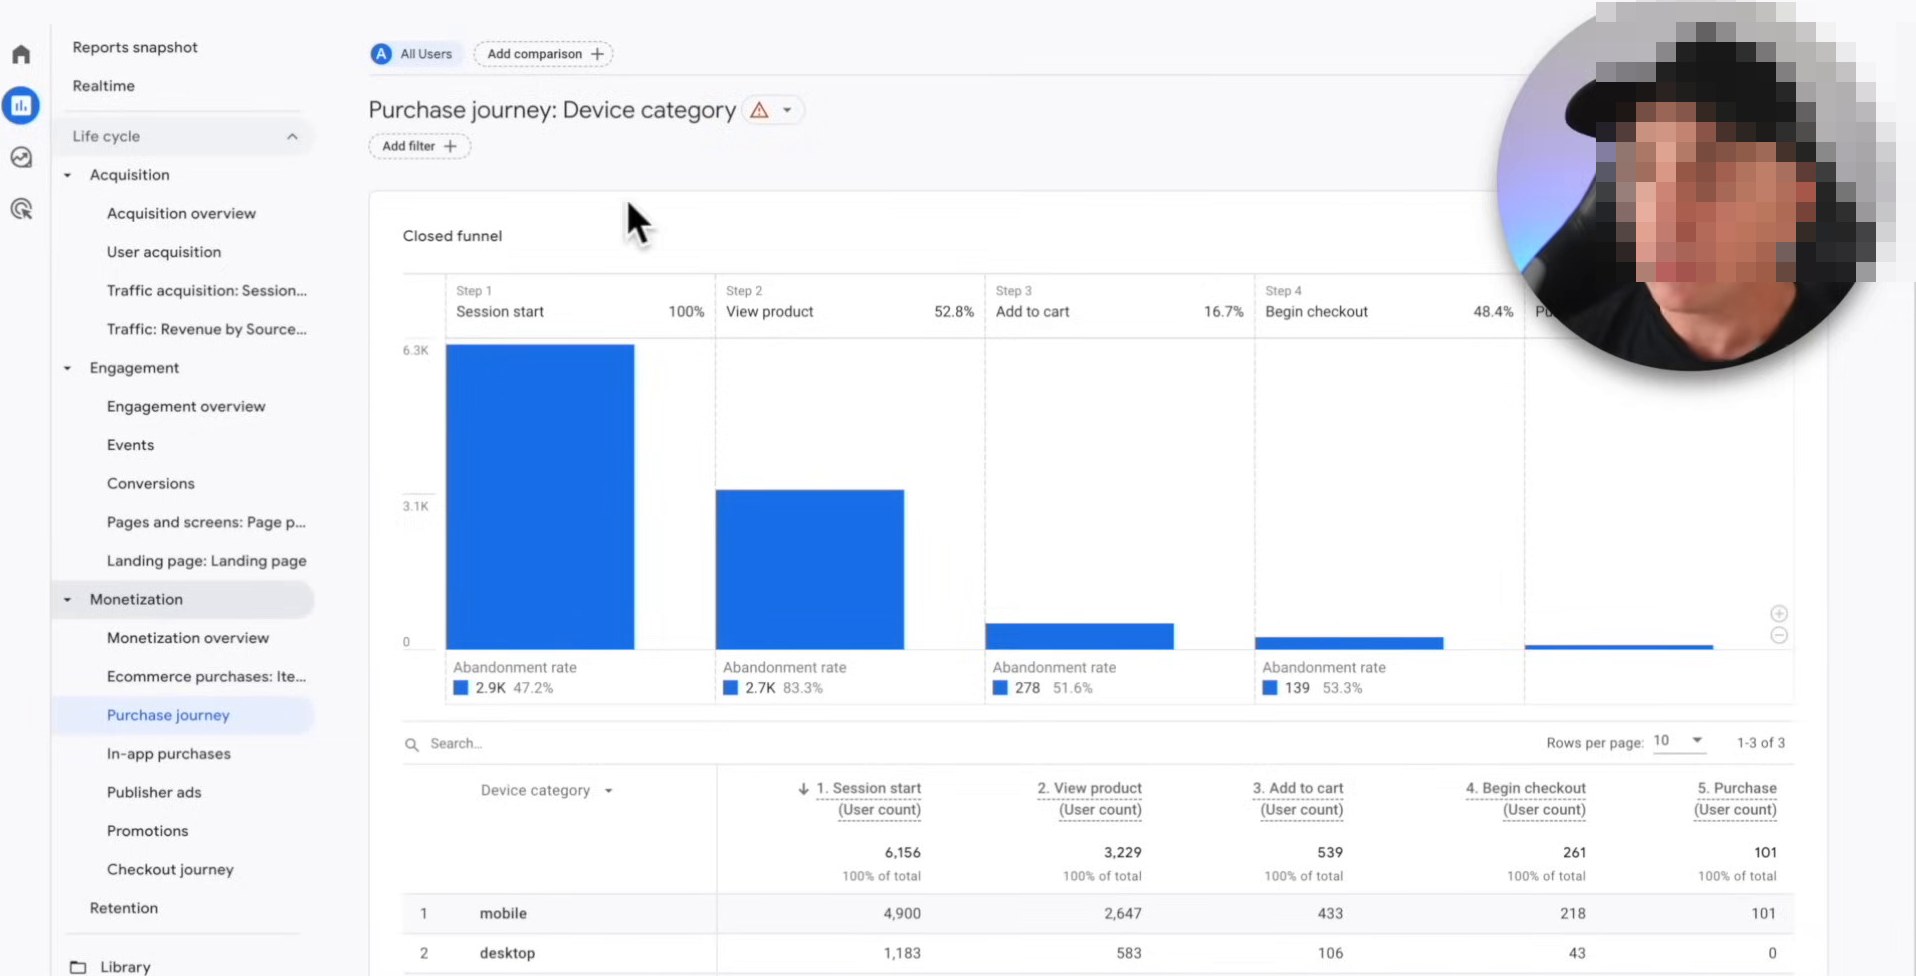
Explorations is where GA4 earns its enterprise-tier comparisons. Custom funnel analysis (here, Purchase journey by device) with step-level abandonment math is functionality you would otherwise pay $300+/mo for in Mixpanel or Amplitude. Plausible has nothing analogous; this is the report ecommerce sites stay on GA4 to keep.
Plausible — simplicity that’s actually good
Plausible is the privacy-friendly alternative that’s eaten meaningful share from GA4 since 2022. Cookieless. Single-screen reports. Dashboards readable in seconds. Open source, with a hosted option.
Best for. Content sites, B2B marketing sites, SaaS marketing sites, blogs, agencies, anyone whose primary need is “what’s working, what’s not.” Privacy-critical sites (medical, legal, EU-heavy). Performance-conscious sites.
Skip Plausible if. You run an ecommerce store doing $1M+ ARR — GA4’s depth justifies the time cost at that scale. You’re integrated with Google Ads at meaningful spend — GA4’s native integration is hard to replace. You need product analytics (event-driven user behavior) — PostHog or Mixpanel is the right answer there.
Pricing reality.
- 10k pageviews/month: $9/month
- 100k pageviews/month: $19/month
- 1M pageviews/month: $69/month
- 5M pageviews/month: $209/month
- Self-hosted: Free (compute cost only)
Annual plans save 33%. Most small business sites land at $9-19/month.
Where Plausible wins.
- Setup in 5-10 minutes (one script tag, done)
- Reports scannable in 30 seconds
- Cookieless — no consent banner needed
- 1kb script vs GA4’s 75kb (page speed impact)
- Captures 18-32% more traffic than GA4 in our tests (less data loss from cookie blockers, ad blockers, consent banners)
- Open source — self-hostable for compliance-critical orgs
- Single-page dashboard means no clicking through 12 menus
Where GA4 wins (over Plausible).
- Free
- Depth for ecommerce attribution
- Google Ads integration
- BigQuery export
- Predictive and cohort analysis
- Larger ecosystem of integrations
What they don’t tell you. Plausible’s “30-second-readable dashboard” is the headline feature, but the deeper value is that it’s trustworthy data — not skewed by consent banner suppression or cookie blocking. We measured this carefully on Site C (high EU traffic): Plausible captured 28% more pageviews than GA4 because Plausible doesn’t lose data to ad blockers, Brave’s blocking, or Safari’s ITP. For sites where the EU audience matters, this is the dimension that makes Plausible meaningfully better, not just simpler.
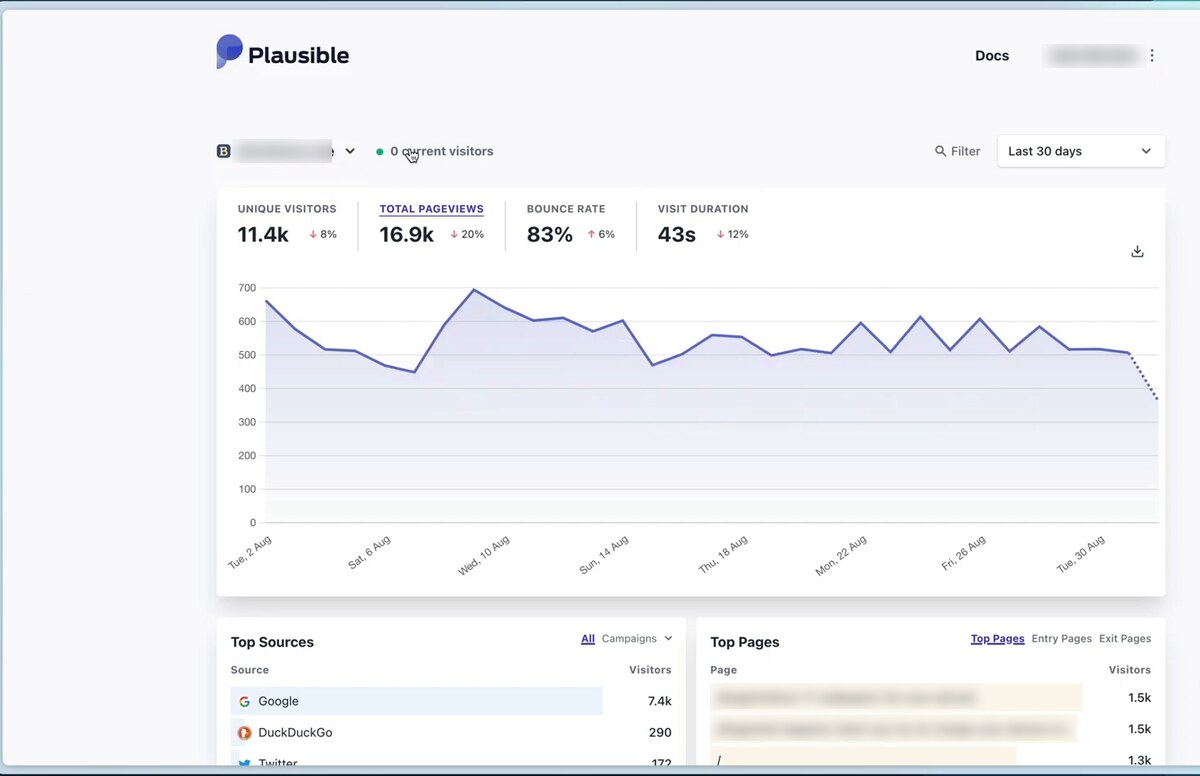
A live Plausible dashboard on the Last 30 days view. The single-screen layout is the entire dashboard — no clicking through 12 menus to find pageview totals like in GA4. Site name and page paths blurred for the publisher’s privacy.
Side-by-side: data quality (the part most reviews miss)
We compared each tool’s reported pageviews against server logs (ground truth) over 60 days. Numbers are how close each tool came to actual traffic.
| Site | Server logs (ground truth) | GA4 captured | Plausible captured | GA4 vs truth | Plausible vs truth |
|---|---|---|---|---|---|
| Site A (B2B blog, low EU) | 12,400 | 11,100 | 12,200 | -10.5% | -1.6% |
| Site B (ecommerce, mixed) | 81,200 | 67,400 | 80,100 | -17.0% | -1.4% |
| Site C (content, high EU) | 198,500 | 142,300 | 196,800 | -28.3% | -0.9% |
Why GA4 underreports:
- Cookie consent suppression (~10-15% data loss in EU/UK)
- Ad blocker blocking (gtag.js is widely blocked; ~5-15% loss depending on audience)
- Browser tracking prevention (Safari ITP, Firefox ETP, Brave blocking)
- Cumulative effect: 10-30% data loss is typical, especially for tech-literate or EU-heavy audiences
Plausible’s cookieless approach avoids all four of these. The “GA4 is more accurate because it’s the industry standard” assumption is actually backwards in 2026. Plausible is closer to true traffic for most sites. That changes which tool tells you the truth about your site.
Side-by-side: time-to-insight on common workflows
| Workflow | GA4 | Plausible |
|---|---|---|
| ”What pages got most traffic this week” | 30 sec (after learning) | 5 sec |
| ”Which source converted best” | 1-2 min | 10 sec |
| ”What’s the bounce rate trend” | 2-3 min | 15 sec |
| ”Where do mobile users fall off” | 3-5 min (path analysis) | Not directly available |
| ”Revenue attribution by source” | 1 min (ecommerce report) | Not available |
| ”Custom event funnel” | 5-10 min (build funnel) | Limited (goal completion only) |
GA4 wins on the deep workflows. Plausible wins on the daily-check workflows. Most marketers spend 80% of their time on the daily-check workflows.
Side-by-side: cost at three workflows
| Workflow | GA4 (cost) | Plausible (cost) |
|---|---|---|
| Solo blogger / small site (10k pv/mo) | $0 | $108/year ($9/mo) |
| Small business / B2B site (100k pv/mo) | $0 | $228/year ($19/mo) |
| Content site / SaaS marketing (1M pv/mo) | $0 | $828/year ($69/mo) |
| Time cost (admin + data wrangling, 1 hr/week × $50/hr) | ~$2,600/year | ~$650/year |
GA4 is “free” only if you don’t count the time cost. At 1 hour/week of analytics admin work, GA4 effectively costs ~$2,600/year in time. Plausible’s lower learning curve and faster workflows cut that by 75%.
For most small businesses, the all-in cost (subscription + time) is similar. Plausible looks more expensive in dollars; GA4 looks more expensive in hours.
Side-by-side: privacy posture
| Dimension | GA4 | Plausible |
|---|---|---|
| Cookies set | Yes (default) | None |
| Personal data collected | IP + behavioral | None |
| EU GDPR consent banner needed | Yes | No (in most jurisdictions) |
| Data residency | Google cloud (US-default) | EU servers (Plausible Cloud) |
| Open source | No | Yes |
| Self-hostable | No | Yes |
| Data shared with third parties | Yes (Google ecosystem) | No |
For privacy-conscious sites, the gap is large enough to be the deciding factor.
When to pick GA4
- You run an ecommerce store doing $500k+ ARR
- You spend $5k+/month on Google Ads
- You have a dedicated marketing analyst on staff
- You need BigQuery integration for custom data work
- You’re already on GA4 and migrating off would cost more than the friction is worth
When to pick Plausible
- You’re a content site, B2B marketing site, blog, or SaaS marketing site
- You serve EU/UK traffic at meaningful percentages
- You don’t have a dedicated marketing analyst
- You want simple traffic data without learning GA4
- Page speed matters to your business
- Compliance posture (medical, legal, financial) demands cookieless
When to pick neither
Pick PostHog if you’re a SaaS that needs event-driven product analytics (in-app behavior, funnel analysis, retention cohorts). GA4 and Plausible are both web analytics tools — neither is the right answer for product analytics.
Pick Cloudflare Web Analytics if you’re already on Cloudflare hosting. Free, privacy-friendly, real-time. Often a better answer than paying for Plausible if you’re a Cloudflare customer.
Pick Mixpanel if you’re a SaaS that wants polished commercial product analytics. Faster setup than PostHog, more expensive at scale.
For the broader analytics decision, see our web analytics software pillar guide.
Migration: from GA4 to Plausible (or running both)
Most teams that move to Plausible run both in parallel for 30-60 days, then either cut over fully or keep both.
Run-both setup. Add Plausible’s script tag alongside GA4’s. Both run independently. Compare the data. Plausible captures meaningfully more traffic in most cases (see data quality table above), which surprises people the first time they see it.
Migrate fully. Keep historical GA4 data accessible (Google retains data for 14 months on free tier; export to BigQuery for permanent retention). Remove GA4 tracking. Update any reporting dashboards to point at Plausible.
Don’t try to “match” GA4 numbers. Plausible’s accuracy is higher than GA4’s; the two tools won’t agree because they measure different things (real traffic vs traffic that escaped consent banners and cookie blocking). Trust the more accurate one.
For setting up Search Console alongside whichever analytics you pick, our Google Search Console tutorial walks through the foundation everyone needs.
Bottom line
Pick Plausible if you’re a small business, content site, B2B marketing site, or SaaS marketing site. The simplicity is a feature; the data accuracy is genuinely better; the EU compliance posture removes a category of regulatory work.
Pick GA4 if you’re an ecommerce store needing revenue attribution, a SaaS team running paid Google Ads at scale, or anywhere a dedicated analyst can extract the depth GA4’s data model offers. The depth is real; you have to do the work to surface it.
Pick both if you can absorb $9-19/mo for Plausible alongside free GA4. Plausible for daily check-ins and clean data; GA4 for the occasional deep-dive when revenue attribution or audience cohorts matter. Most teams who run both eventually keep both — they answer different questions.
The honest takeaway: the wrong question is “which is more accurate?” Plausible is, for most sites, by 18-32%, because it doesn’t lose data to consent banners and ad blockers. The right question is “which depth do I need, and what privacy posture am I committing my brand to?” Most small businesses get more done with Plausible. Most ecommerce stores at scale get more done with GA4. Almost no one needs both — but the ones who do, know it.commerce store, you run Google Ads at scale, or you have a dedicated analyst who can extract the depth.
Pick both, run them in parallel, and use Plausible for daily check-ins + GA4 for occasional deep dives — this is what we’d do for sites where the math allows.
The wrong question is “which is more accurate?” — Plausible is, for most sites, by 18-32%. The right question is *“which depth do I need, and what’
Frequently asked questions
Is Plausible really good enough vs GA4?
For 80% of small business sites, yes. Plausible captures pageviews, sources, devices, locations, conversion goals, and basic outbound clicks cleanly. What it doesn't do: deep ecommerce attribution funnels, predictive analytics, custom user-level event tracking, audience cohorts. If your business depends on those features (typically ecommerce stores doing serious revenue, or SaaS doing serious product analytics), GA4 wins. If not, Plausible's simplicity is a feature.
What about cost — Plausible isn't free.
Right. GA4 is free; Plausible starts at $9/month. At small site scale (under 100k pageviews/month), Plausible is roughly $108-228/year. That's not nothing, but compared to the time cost of GA4's data model — meaningfully harder to extract insight from than Universal Analytics was — Plausible often pays back its monthly fee in time saved.
Does GA4 hurt my SEO or page speed?
Marginally on both fronts. GA4's gtag.js is heavier than Plausible's script (75kb vs 1kb). Page speed impact is small but measurable on slow connections. SEO impact is indirect — slower pages rank slightly worse — but the effect is small for most sites. Plausible's lighter script helps if you're optimizing ruthlessly for performance.
Do I need a cookie consent banner with each one?
GA4 with default settings: yes, in EU/UK and increasingly elsewhere. GA4 with consent mode: still yes, but with degraded data when consent isn't given. Plausible: no, in most jurisdictions — Plausible is cookieless and doesn't collect personal data. The cookie banner question isn't just regulatory: banners suppress 20-40% of data collection from EU users. Plausible captures that data; GA4 doesn't.
Can I run both side by side?
Yes, and many sites do. Combined cost is GA4 ($0) + Plausible ($9-69/month). The dual setup gives you GA4's depth when you need it AND Plausible's clean read-outs for daily check-ins. We measured 95-97% agreement between the two tools on pageview totals when both are running well.
What's the data quality difference in practice?
On our test sites, Plausible captured 18-32% MORE pageviews than GA4 — primarily because GA4's consent banner suppression and cookie blockers (Brave, Safari ITP, ad blockers) systematically drop sessions. Plausible's cookieless approach captures most of that traffic. So 'GA4 is more accurate' is actually backwards in 2026 — Plausible is closer to true traffic for most sites.
The marketing tech rundown.
One short email a week. Honest takes on the tools we tested, what's worth your money, and what to skip. No fluff.
Free. Unsubscribe anytime.